Five dashboards nobody was opening
· 5 min · Automation, Operations, Slack, Analytics
The ask was small. Once a month, post a summary of how the website is doing into Slack, so nobody has to log into five separate tools to find out.
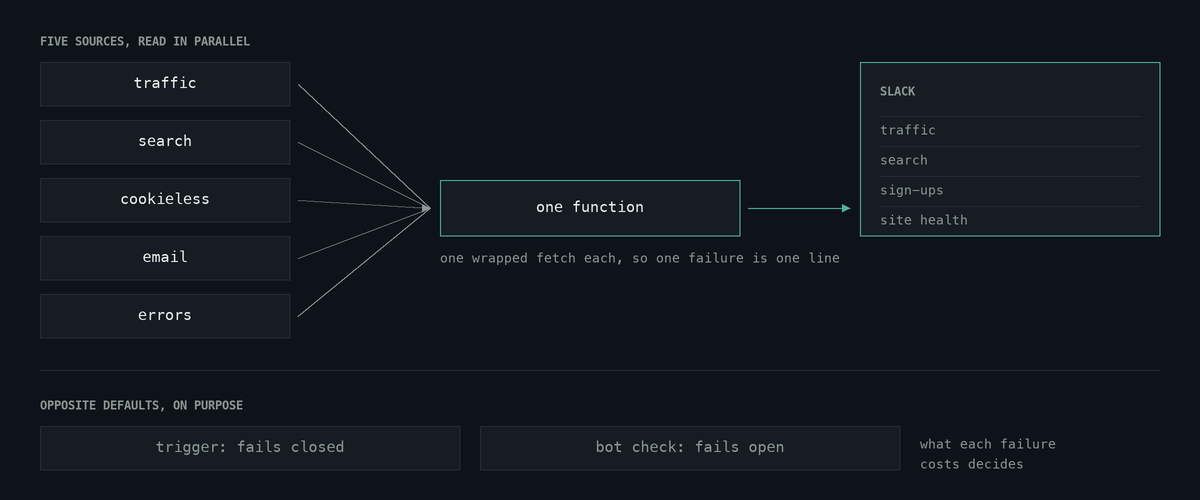
Five tools, because that is what measuring a website honestly takes now: analytics for traffic, Search Console for how people arrive, a second cookieless analytics tool as a cross-check, the email platform for sign-ups, and the error tracker for whether anything is broken. Each has its own login, its own interface, and its own way of framing the same question. The result was predictable: most months, nobody checked.
The report is the easy half
Reading five APIs and formatting a message is an afternoon. What took the time was deciding what each number could honestly be said to mean, and then building something that would keep being true when one of the five had a bad day.
The message ended up in four sections: traffic, search, sign-ups, and site health. Each leads with the figure that matters, set as a label above a value rather than written out as a sentence. That sounds cosmetic and is not. A paragraph asks to be read; a label and a number can be taken in at a glance, and the whole point was that this be readable in thirty seconds by someone who was never going to open a dashboard.
Every source fails on its own
The naive shape is one function that fetches five things and posts the result. It works until an API is slow, and then the whole run throws, nothing is posted, and nobody notices for a month. A monthly job is the worst possible place for a silent failure, because the feedback loop is thirty days long.
So each source is fetched independently and wrapped. If one is unavailable, its section says so in one honest line and the other four still post. Partial truth beats silence, and the line saying "search figures unavailable this month" is itself useful information, where an absent message is not.
Failing closed, and failing open, on purpose
The endpoint that triggers the report refuses to run without its shared secret, compared in constant time. The bot check on the site's signup form does the opposite: if the verification service is unreachable, the form submits anyway.
Those are opposite choices and both are right. Failing open on a bot check costs you a bot check, and blocking real sign-ups during somebody else's outage is the worse outcome. Failing open on a write endpoint hands anyone who finds the path the ability to post into a team channel. The question is never "should this fail open or closed" in the abstract. It is what each failure actually costs.
A pause switch that survives a deploy
The schedule lives in version-controlled config. Turning it off in the hosting dashboard therefore lasts exactly until the next deploy puts it back, which is the kind of thing you discover by watching someone stop it three times and wondering why it keeps returning.
The durable control is an environment variable, precisely because it is not in git. Anything you can disable from a dashboard but that also exists in the repository will be re-enabled by the repository eventually.
Counting the right thing
Two small decisions did more for the report's credibility than anything else.
The error tracker reports a lifetime count per issue, not a count for the period you asked about. Summing those into a monthly report would re-report every historical occurrence every month, so the number could only ever climb, and a rising error count that means nothing is worse than no error count at all. The report counts issues active in the window instead.
And the errors are classified into ours and not ours with a deliberately tiny allowlist, everything unrecognised defaulting to ours. The temptation is the reverse, because a generous "not our problem" rule makes the report look calmer. It also buries things. A false "needs a look" costs somebody a glance. A false "not our problem" costs weeks.
What it found on the way
Wiring up the sources turned up a live failure that had nothing to do with reporting: the newsletter form on the homepage had been rejecting most attempts since launch. The bot-check token is minted at page load and expires after a few minutes, and that form sits at the bottom of the longest page on the site, so anyone who actually read on the way down arrived with an expired token. The fix was to mint the token at submission instead of trusting the one from page load.
The evidence for that was strong, from event data and the error tracker, though the expiry was never reproduced in a live session, and the failure rates come from event tracking rather than reconciled records. So the fix is the durable part and the numbers are not quoted.
Two monitoring systems had been recording it the whole time. Nobody was reading either of them, which is the same problem the digest exists to solve, arriving from a different direction.
What shipped
A scheduled function, five sources read in parallel in under ten seconds, one Slack message in a workspace the team already uses, and a runbook covering every credential, every failure mode hit while building it, and how to pause and resume it safely. That last part is not documentation for its own sake: an automation only one person can operate is a liability wearing the costume of an asset.